 HOME
HOME
 Research Top
 E. coli auxotrophic expression strains
 古細菌 Archaea | Sulfurisphaera tokodaii (f. Sulfolobus tokodaii)
 モデル鉄硫黄蛋白質|Fe-S world in Sulfolobus
 ISC-like ferredoxin (FdxB) from P. putida
 Microbial "mitoNEET" homologs
 Archaeal respiratory complex II
 複合金属酵素の発現
 Ligand mutagenesis
 鉄硫黄酵素の分光学
 金属コファクターの分子進化
 ICC Project
日本医科大学、医学部、生化学・分子生物学(代謝・栄養学)所属の 岩崎 俊雄グループでは、好熱菌等を主材料とした各種金属酵素の構造機能進化や、アミノ酸要求性の新規大腸菌発現宿主株作成につき、国内外の様々な研究機関と共同研究を実施しています。
 Publication List
 Go to the Research Top Page
ISC-like [2Fe-2S] ferredoxin (FdxB) from Pseudomonas putida JCM 20004
Biological iron-sulfur (Fe-S) clusters, consisting of non-heme iron and inorganic sulfide atoms, are functionally versatile and may be among the most ancient modular prosthetic groups. The electronic structure and the site of iron reduction of these protein-bound cofactors account for the electron transfer function and mechanism. In the present work we have solved the 1.90-Å structure of the ISC-like [2Fe-2S] ferredoxin called FdxB from the non-pathogenic gammaproteobacterium Pseudomonas putida JCM 20004 (formerly Pseudomonas ovalis IAM 1002). This FdxB protein contains an adrenodoxin like, redox-active [2Fe-2S] cluster, which plays an essential but ill-defined role in the de novo iron-sulfur cluster assembly (ISC) system. It is encoded by the fdxB gene as a constituent of the cognate iscR-iscS1-iscU-iscA-hscB-hscA-fdxB gene cluster for the ISC system (DDBJ-EMBL-GenBank code AB109467; Fig. 1).
In P. putida the ISC pathway is apparently the sole system for in vivo Fe-S cluster assembly whereas the SUF pathway is missing in the bacterial genome (unlike in Escherichia coli).
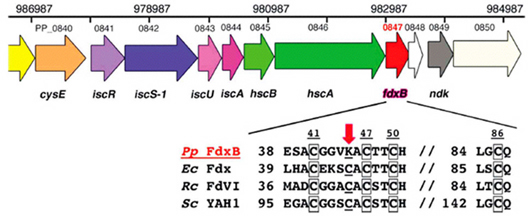
Figure 1. Schematic organization of the isc gene cluster, the products of which are involved in the Fe–S cluster-biosynthesis (ISC) machinery, in the whole-genomic DNA sequence of P. putida KT2440, a close relative of strain JCM 20004 used in this work (top). The primary sequence of P. putida JCM 20004 FdxB (DDBJ/EMBL/GenBank code AB109467) is completely identical to that of P. putida KT2440 open reading frame PP_0847. Multiple sequence alignment of selected ISC-like [2Fe–2S] ferredoxins (bottom) indicates that the cluster-binding site of FdxB (bottom) lacks the conserved cysteine residue (underlined) near the [2Fe–2S] cluster (indicated by a red arrow; see Fig. 5) that has been proposed to provide a potential ligand for an S atom or an Fe3+ ion during the action of the ISC machinery. Accession numbers: P. putida JCM 20004 (Pp) FdxB, DDBJ/EMBL/GenBank code BAD01054; Escherichia coli (Ec) Fdx, PDB code 1i7h; Rhodobacter capsulatus (Rc) FdVI, PDB codes 1e9m and 1uwm; Saccharomyces cerevisiae (Sc) YAH1, GenBank code NP_015071. The metal-binding motifs are boxed.
Crystallization
Recombinant FdxB was heterologously overproduced in E. coli BL21-CodonPlus(DE3)-RIL strain, purified and crystallized in its oxidized form by the hanging-drop vapor diffusion and streak-seeding methods using 1.6 M trisodium citrate dihydrate pH 6.5 (Fig. 2). The thin needle-shaped crystals diffract to 1.90 Å resolution and belong to the hexagonal space group P6122, with unit-cell parameters a = 87.58, c = 73.14 Å. The asymmetric unit contains one protein molecule.
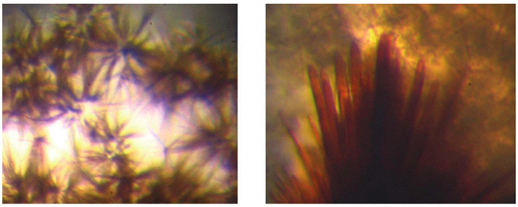
Figure 2. Typical crystals of recombinant FdxB obtained (left) before and (right) after streak-seeding with a human hair.
*One can follow the link to read the original article of this work.
up
The 1.90-Å structure of the ISC-like [2Fe-2S] ferredoxin, FdxB
The FdxB structure has a βαββαβ fold with the β-grasp/ubiquitin-like fold motif as found in regular eukaryal and bacterial [2Fe-2S] ferredoxins (also called the vertebrate ferredoxin subclass) such as bovine adrenodoxin (Adx), putidaredoxin (Pdx), and other bacterial ISC-like ferredoxins (e.g. 1i7h.pdb, 1cje.pdb, 1e9m.pdb). FdxB is folded into an (α+β) core fold domain and an extended C-terminal tail (Fig. 3). In the lattice FdxB was found to be homo-dimeric, displaying the isologous association of the extended C-terminal tail from each protomer (Figs. 3, 4).
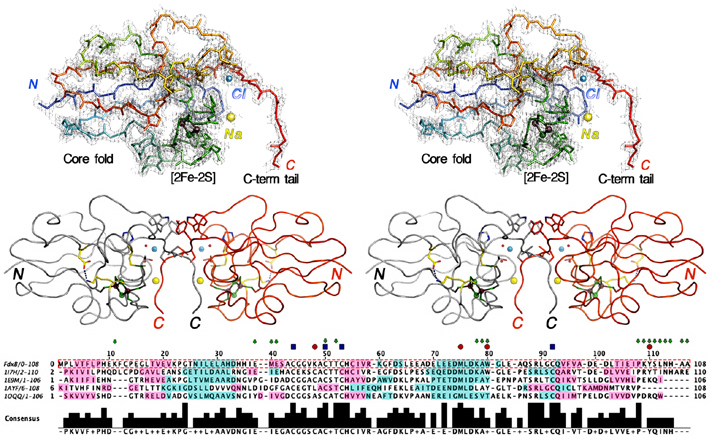
Figure 3. (Top) Wall-eye stereoview of the backbone tracing of the P. putida FdxB protomer (colors changing gradually from the amino terminus (blue) to the carboxyl terminus (red)) together with the observed 2Fo-Fc map contoured at 1.5 σ (gray). The refined model includes the FdxB protomer from Pro1 to Ala108 plus one extra residue at the amino terminus (Met) derived from the expression vector and a [2Fe-2S] cluster (Fe as dark brown and S as green spheres), as well as 152 water (not shown in the figure), one sodium (yellow sphere) and one chlorine (cyan sphere) molecules from the mother liquor. A total of four amino acids at the C-terminus were disordered and not resolved in the electron density. (Middle) Stereoview of the tail-to-tail dimer organization of FdxB with protomers colored gray and red. (Bottom) Structural alignment of FdxB with related [2Fe-2S] proteins, E. coli Fdx (1I7H.pdb), R. capsulatus FdVI (1E9M.pdb), adrenodoxin (Adx) (1AYF.pdb) and putidaredoxin (Pdx) (1OQQ.pdb), drawn by using the program STRAP. Keys: green arrows, residues located in the dimer interface of the FdxB structure; blue squares, cysteine ligand residues; red circles, residues discussed in text.
The contact surface includes not only the residues in the C-terminal tail (Pro100-Lys101-Tyr102-Ser103-Leu104-Asn105-His106-Ala107-Ala108) but also those in the (α+β) core fold domain (Lys10, Glu36-Met37-Glu38, Cys47 (a [2Fe-2S] cluster ligand), Thr49, Lys74-Ala75-Trp76), plus two internal water molecules and one sodium ion in each protomer (Fig. 4). A possible physiological relevance of this dimeric structure is under investigation.
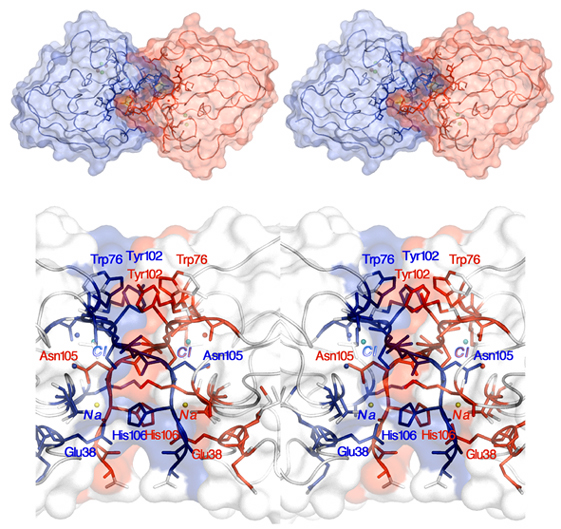
Figure 4. Stereoview of the FdxB dimer in a space-fill representation (with each protomer depicted in different colors), viewed from the "C-terminal-tail" face of the protein (top). Close-up stereoviews of the FdxB dimer in the tail-to-tail dimer interface region, depicted in the same view as in Fig. 3, where contact atoms (residues and solvent molecules) are colored in blue and red, except for sodium (yellow sphere) and chloride (cyan sphere) atoms (bottom).
Each FdxB protomer binds a [2Fe-2S] cluster that is coordinated by four terminal cysteine sulfur atoms, where the outermost iron (Fe1) near the protein surface is coordinated by Cys41Sγ and Cys47Sγ and the innermost iron (Fe2) by Cys50Sγ and Cys86Sγ (Fig. 5). In the dimeric structure, two [2Fe-2S] clusters are separated at the closest iron-to-iron (Fe1-Fe1) distance of 25 Å (Fig. 3), suggesting that a rapid interprotomer electron transfer between them would be unlikely to occur. In the place of the consensus free cysteine usually present near the [2Fe-2S] cluster of ISC-like ferredoxins, FdxB has the Lys45 side chain which forms a salt-bridge interaction with Asp65Oδ2 (Fig. 5). Thus, the overall FdxB structural features argue for its primarily electron transfer role in the cognate ISC system, rather than the direct catalytic function.
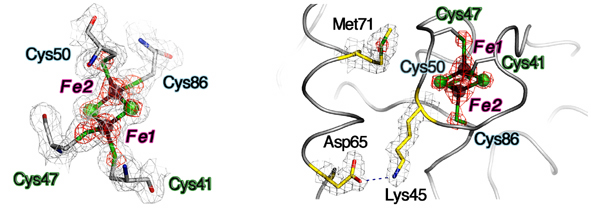
Figure 5. The [2Fe-2S] cluster binding site of FdxB. An expanded view of one [2Fe-2S] cluster showing the cluster and iron ligands and the corresponding observed 2Fo-Fc map contoured at 1.5 σ (gray) and 6 σ (red) (left). Locations of Lys45, Asp65 and Met 71 (yellow sticks), together with the corresponding observed 2Fo-Fc map contoured at 1.5 σ (gray) and 6 σ (red), relative to the [2Fe-2S] cluster (right).
*The coordinates and structural factors have been deposited in the Protein Data Bank (PDB ID code: 3AH7). Interactive 3D images of the FdxB structure can be found in Proteopedia.
up
Electron-nuclear double resonance (ENDOR) analysis of FdxB
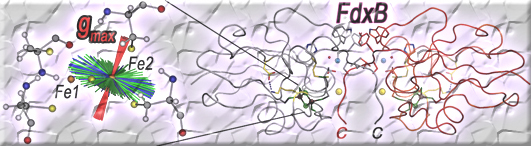
With the molecular structural frame determined from the FdxB structure (PDB code: 3AH7), our ENDOR analysis in collaboration with Dr. Reinhard Kappl (Universität des Saarlandes, Germany) (Fig. 6) has allowed to determine the average gmax direction of the reduced FdxB, which is skewed, pointing roughly towards Cys50Cα and forming an angle of about 27.3 (±4) degrees with the normal of the [2Fe-2S] plane, while the gint- and gmin-directions are distributed in a plane tilted toward the cluster plane (Fig. 7). The site of reduced iron in the reduced FdxB is the outermost Fe1 site with the low negative spin density, while the innermost Fe2 site with the high positive spin population is the non-reducible iron retaining the Fe3+-valence of a reduced cluster (Figs. 5, 7).
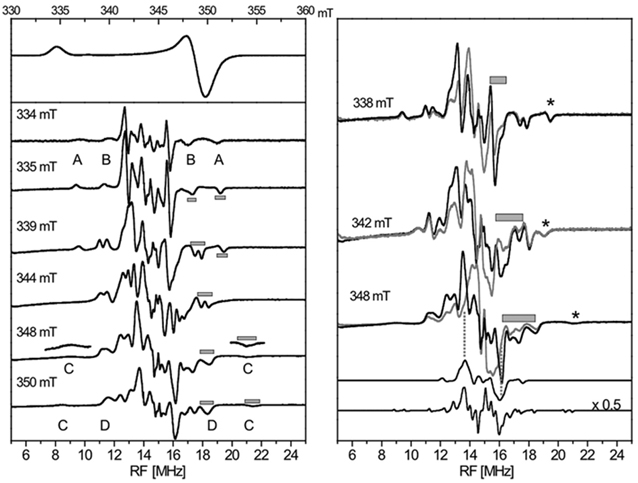
Figure 6. EPR spectrum of reduced FdxB (56Fe, H2O) (left, top), and some continuous wave-1H-ENDOR spectra measured at field positions indicated, showing the evolution of the ENDOR pattern (left, bottom). Outer ENDOR lines are marked A-D for the assignment to specific protons. The gray bars, as examples, give the frequency range of the line width used as input for the automatic calculations. Comparison of ENDOR spectra at the given field positions for samples in aqueous and deuterated buffer (in gray) (right). The gray bars indicate regions with a loss in signal intensity for D2O specimen. The spectra were normalized in intensity by adjusting the resonances at the highest frequency (marked by asterisks). The lower two spectra in the right panel are simulations for all exchangeable NH-protons near the cluster, indicating their frequency range, and for eight β-protons of four cysteine ligands to the [2Fe-2S] cluster (right bottom spectrum). The latter spectrum is reduced in intensity. This figure was prepared by Dr. Reinhard Kappl (Universität des Saarlandes, Germany).
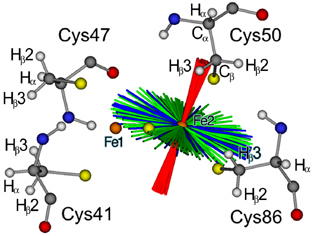
Figure 7. Skewed orientations of the gmax-component with respect to the molecular frame of the [2Fe-2S] cluster of FdxB. The possible orientations of the gmax-component (red) in a tilted arrangement with respect to the [2Fe-2S] cluster of FdxB, derived from calculation with the automatic routine including the four lines A-D and an exchangeable NαH proton (see Fig. 6). The intermediary and minimal g-directions are distributed in the perpendicular plane (green, gint; blue gmin). Atoms are colored as H, white; C, gray; N, blue; O, red; S, yellow; Fe, orange spheres. This figure was prepared by Dr. Reinhard Kappl (Universität des Saarlandes, Germany).
From a structural point of view, the larger number of polarized (or polarizable) bonds (NH, OH) and the extended hydrogen bonding network around Fe1 in FdxB may be the crucial factor favoring the accommodation of the reducing electron at the outermost Fe1 site (Fig. 8). These results are related with other [2Fe-2S] proteins in different electron transport chains (e.g., adrenodoxin) and suggest a significant distortion of the electronic structure of the reduced [2Fe-2S] cluster under the influence of the protein environment around each iron site in general.
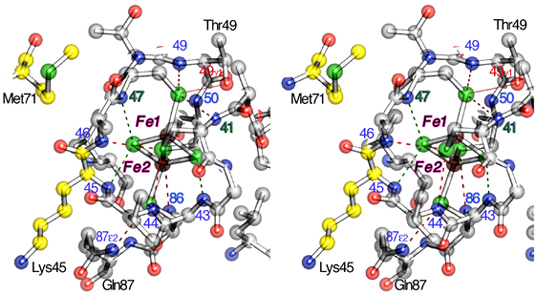
Figure 8. Stereoview of the hydrogen bond network around the [2Fe-2S] cluster binding site (in ball-and-stick representation). Residue numbers are indicated in the figure.
*One can follow the links to read the original article of this work and interactive 3D complement in Proteopedia.
up
2D electron spin-echo envelope modulation (ESEEM/HYSCORE) analysis of FdxB
The 1.90-Å structure of P. putida FdxB (PDB ID code: 3AH7) shows an extensive (N/O)–H…S hydrogen bond network around the [2Fe–2S] cluster, with nearly the same pattern as found in other closely related homologs such as adrenodoxin and putidaredoxin, including a conserved N–H…S hydrogen bond between the Nε of Gln87 and the Cys86 Sγ ligand at the Nε–Sγ distance of 3.4 Å in FdxB (Fig. 9a). The extensive (N/O)–H…S hydrogen bond network around the biological iron–sulfur clusters is one of the most important themes in modulating their redox properties and potential electron transfer pathways in biological electron transfer conduits. Paramagnetic relaxation due to the reduced (antiferromagnetically coupled Fe3+ – Fe2+) cluster severely broadens signals from nuclei in the vicinity (8 Å) of the paramagnetic centers, making it difficult to fully assign hyperfine interactions with the paramagnetic metal center by multidimensional heteronuclear NMR. Pulsed EPR (2D ESEEM, also called hyperfine sublevel correlation, HYSCORE) can also be used to characterize the nuclear spin interactions with the paramagnetic center. Uniformly 15N-labeled FdxB (denoted as U-FdxB) was prepared, but the 2D ESEEM spectra did not resolve individual nuclei, showing only two broad (aggregate) 15N cross-features with apparent hyperfine splittings of 1.2 and 0.2 MHz, respectively (Fig. 9b).
Selective labeling of amino acids with stable isotopes, applied in conjunction with a number of spectroscopic techniques such as NMR, EPR, resonance Raman, and infrared (IR) spectroscopies, is undoubtedly a powerful method in deciphering the structures and mechanisms of proteins. Therefore, FdxB was prepared with glutamine specifically 15N-labeled at the Nε position (denoted as Gln-FdxB). The HYSCORE spectra collected from Gln-FdxB clearly resolve, for the first time, the sharp cross-peaks assigned to a single N–H…S hydrogen bond interaction between the 15Nε of Gln87 and the terminal Cys86 Sγ ligand of the reduced cluster in Gln-FdxB, with the isotropic hyperfine splitting of 0.9 MHz (Fig. 9c). This is usually impossible even with the use of uniformly 15N-labeled proteins, presumably because of the significant spectral overlap of many weakly coupled 15N nuclei from the peptide backbone near the cluster.
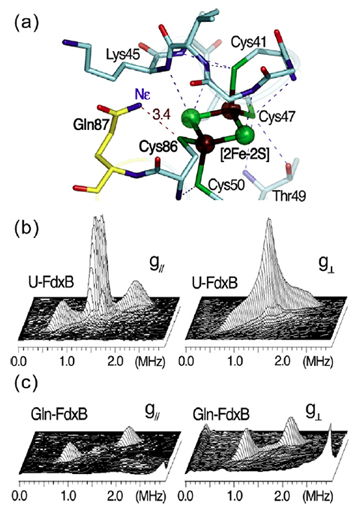
Figure 9. The hydrogen bond network around the [2Fe-2S](Cys)4 cluster binding site in the 1.90-Å structure of P. putida FdxB (PDB code: 3AH7) (a) and the 2D ESEEM (HYSCORE) characterization of weakly coupled 15N nuclei in uniformly 15N-labeled FdxB (U-FdxB) (b) and selectively Gln15Nε-labeled FdxB (Gln-FdxB) (c) in the reduced state. The HYSCORE spectra in 3D stacked presentation (b,c) were measured at the low-field edge of the EPR line near g// (342.5 mT, left) and the intermediate position at g⊥ (357 mT, right). The cross-peaks for 15Nε of Gln87, which is involved in the N-H…S hydrogen bond with Cys86 Sγ (a), were clearly resolved with the hyperfine splitting of ~0.9 MHz ((2.01, 0.92) MHz and 15A=1.09 MHz near g// (left); (1.95, 1.13) MHz and 15A=0.82 MHz at g⊥ (right)) in the Gln-FdxB spectra (c).
*One can follow the link to read the original article of this work.
up
Unpaired electron spin density distribution across reduced [2Fe-2S](His)n(Cys)4-n (n = 0, 1, 2) cluster ligands by 13Cβ-cysteine labeling
The biological functions of Fe-S clusters are predominantly determined by the number and types of coordinating ligands (typically cysteine and histidine) that modifiy the electronic structure of the cluster, and electron transfer between redox-active cofactors and their biological partners depends critically on the extent of electron orbital overlap. The proximity of the redox centers is the primary factor in facilitating efficient electron transfer, which can be modeled by the edge-to-edge distance between the cofactors, or by more sophisticated models using the distribution of electron spin density as a probe in quantum/molecular mechanics calculations for mapping out potential electron transfer pathways. The distribution of electrons within the redox-active cofactor is directly linked to the biological electron transfer mechanism, where the pattern of unpaired spin delocalization may play an important role.
In an orientation-selective pulsed EPR experiment, the hyperfine interactions of the paramagnetic center with the surrounding nuclei are measured as a function of the g-tensor orientation. This is achieved by taking measurements at different magnetic fields, thereby exciting only a subset of g-values out of the full g-tensor at a time. In order to determine the hyperfine interactions with the nearby Cys-13Cβ's, the orientation-selective 13C-HYSCORE analysis is performed on selectively Cys-13Cβ-labeled [2Fe-2S](His)n(Cys)4−n (n = 0, 1, 2) protein samples (reduced in the S = 1/2 spin state) in the 15N-protein background, prepared by using E. coli cysteine auxotrophic expression host strain YM154 (Figs. 10, 11).
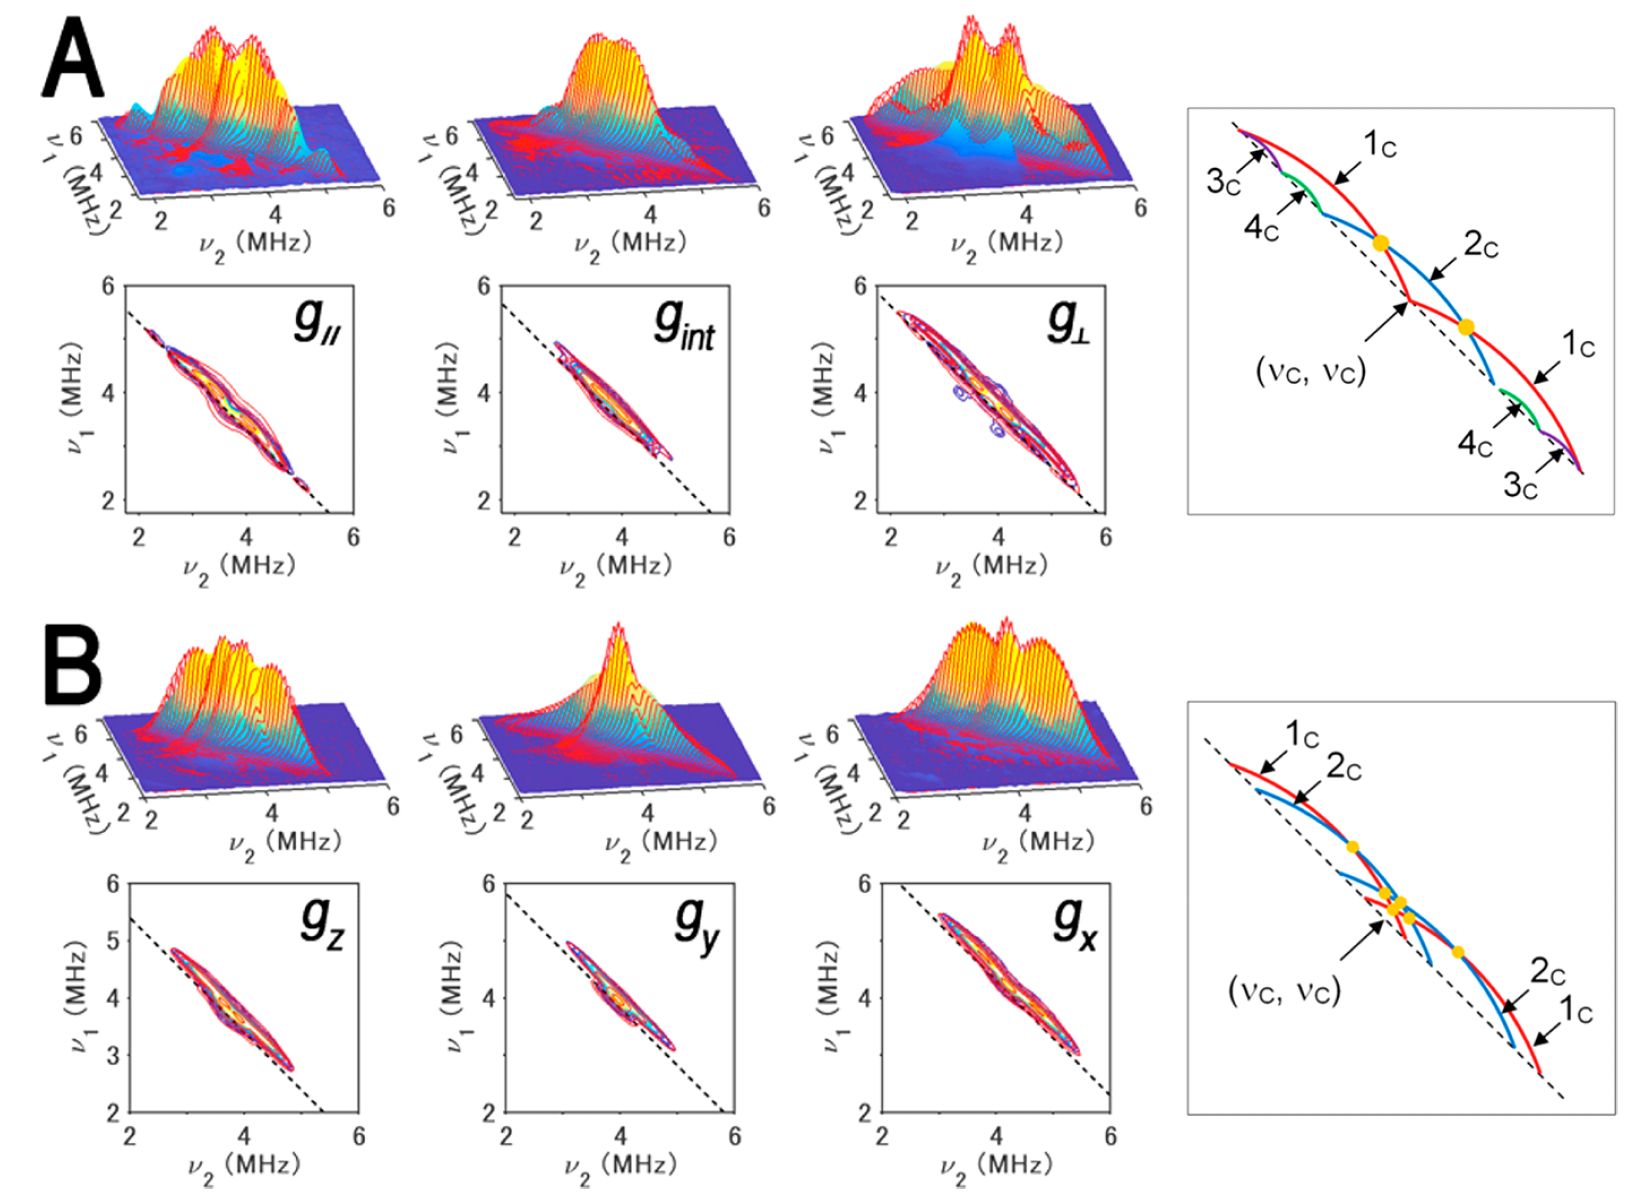
Figure 10. 13Cβ(Cys) HYSCORE spectra of FdxB measured at g|| (left), gint (middle left), and g⊥ (middle right) (A) and ARF measured at gz (gmax) (left), gy (gint) (middle left), and gx (gmin) (middle right) (B), shown in three-dimensionally stacked (top) and contour (bottom) representations, respectively, and schematic diagrams (right) of the powder 13C HYSCORE spectra of 13Cβ-Cys-labeled, reduced FdxB (A) and ARF (B) in the 15Nprotein background for the simulated cross-ridge line shapes (the schematic figures are not drawn to scale, and the cross-ridge curvature is exaggerated for the sake of clarity). The spectral simulations are colored red overlaying the experimental 13C HYSCORE spectra in the (++) quadrant. In the contour representations, the dashed lines along the antidiagonal are defined by να + νβ = 2ν(13C). In the optimized EasySpin simulations of the FdxB spectra (A), two 13Cβ(Cys) tensors, 3c (a = 2.8 ± 0.1 MHz; T = 0.5 ± 0.1 MHz; δ = 0; Euler angles α = 0°, β = 50°, and γ = 0°) and 4c (a = 1.8 ± 0.2 MHz; T = 0.5 ± 0.2 MHz; δ = 0; Euler angles α = 0°, β = −60°, and γ = 0°), have simple cross-peak shapes lying along the dashed antidiagonal line defined by να + νβ = 2ν(13C), and two anisotropic 13Cβ(Cys) tensors of similar low rhombicity, 1c (a = 1.1 ± 0.2 MHz; T = 1.3 ± 0.1 MHz; δ = 0.2 ± 0.1; Euler angles α = 40 ± 180°, β = 81 ± 12°, and γ = 33 ± 62°) and 2c (a = −0.2 ± 0.2 MHz; T = 1.2 ± 0.1 MHz; δ = 0.2 ± 0.2; Euler angles α = −30 ± 180°, β = −19 ± 11°, and γ = 82 ± 180°), make up the more intensive “arc-shaped” cross-ridges shifted off of the antidiagonal in the (++) quadrant (right), where the principal values of the rhombic hyperfine tensor are [a − T(1 + δ), a − T(1 − δ), a + 2T] and the rhombicity parameter δ ranges from 0 (axial tensor) to 1 (rhombic tensor). 2c has a very small isotropic constant, thus being represented with only a single cross-ridge symmetric about the diagonal in the FdxB spectra, and points of cross-ridge overlap producing the 1c+2c peaks in the stacked spectra are indicated with orange circles (right). For ARF (B), the overall experimental spectra showing the intense “arc-shaped” 13C crossridges off the antidiagonal line were successfully reproduced by EasySpin simulations with two anisotropic 13Cβ(Cys) tensors of similar low rhombicities, 1c (a = 0.8 ± 0.2 MHz; T = 1.3 ± 0.1 MHz; δ = 0.1 ± 0.1; Euler angles α = −35 ± 10°, β = −59 ± 9°, and γ = 89 ± 33°) and 2c (a = 0.4 ± 0.2 MHz; T = 1.3 ± 0.1 MHz; δ = 0.2 ± 0.1; Euler angles α = 25 ± 22°, β = 53 ± 6°, and γ = 0 ± 14°), where the heavy overlap of 1c and 2c results in peaks (orange circles) that can be identified as only 1c+2c (right). Experimental parameters: magnetic fields of 341.5 mT (g||), 347.0 mT (gint), and 355.7 mT (g⊥); a microwave frequency of 9.646 GHz; and a temperature of 20 K for the FdxB spectra (A) and magnetic fields of 344.0 mT, (gz), 364.0 mT (gy), and 386.2 mT (gx); a microwave frequency of 9.696 GHz; and a temperature of 10 K for the ARF spectra (B). This figure was prepared by Dr. Alexander Taguchi.
For the reduced [2Fe-2S] cluster in P. putida FdxB with a complete cysteinyl coordination (gmax (g||) = 2.020, gint = 1.936, gmin = 1.934), 13C HYSCORE spectra showed four 13Cβ-(Cys) cross-features resolved by optimized EasySpin simulations, with two anisotropically elongated cross-ridges from the Cys86 (1c) and Cys50 (2c) ligands coordinated at the non-reduced Fe3+ site, and two additional components at low contour levels with weak anisotropy (3c and 4c) from Cys41 and Cys47 at the Fe2+ site (Fig. 10A). At the Fe3+ site of the reduced cluster, the magnitude of the electron spin population at Cys50 13Cβ is significantly smaller than that at Cys86 13Cβ in FdxB.
The 13C HYSCORE spectra of reduced archaeal Rieske-type [2Fe-2S](His)2(Cys)2 ferredoxin (ARF, gz = 2.022, gy = 1.901, gx = 1.804) from Sulfolobus solfataricus strain P1 showed only elongated 13Cβ(Cys) cross-ridges that are shifted off the antidiagonal dashed line defined by να + νβ = 2ν13C (Fig. 10B); these cross-features 1c and 2c, characteristic of 13C tensors with significant hyperfine anisotropy, are similar to those observed for the cross-ridges 1c and 2c in the FdxB spectra (Fig. 10A), but have unresolved individual contributions from the Cys42 and Cys61 ligands coordinated at the Fe3+ site (Fig. 10B), owing to the relatively similar magnitudes of the electron spin populations at Cys42 13Cβ and Cys61 13Cβ in reduced ARF.
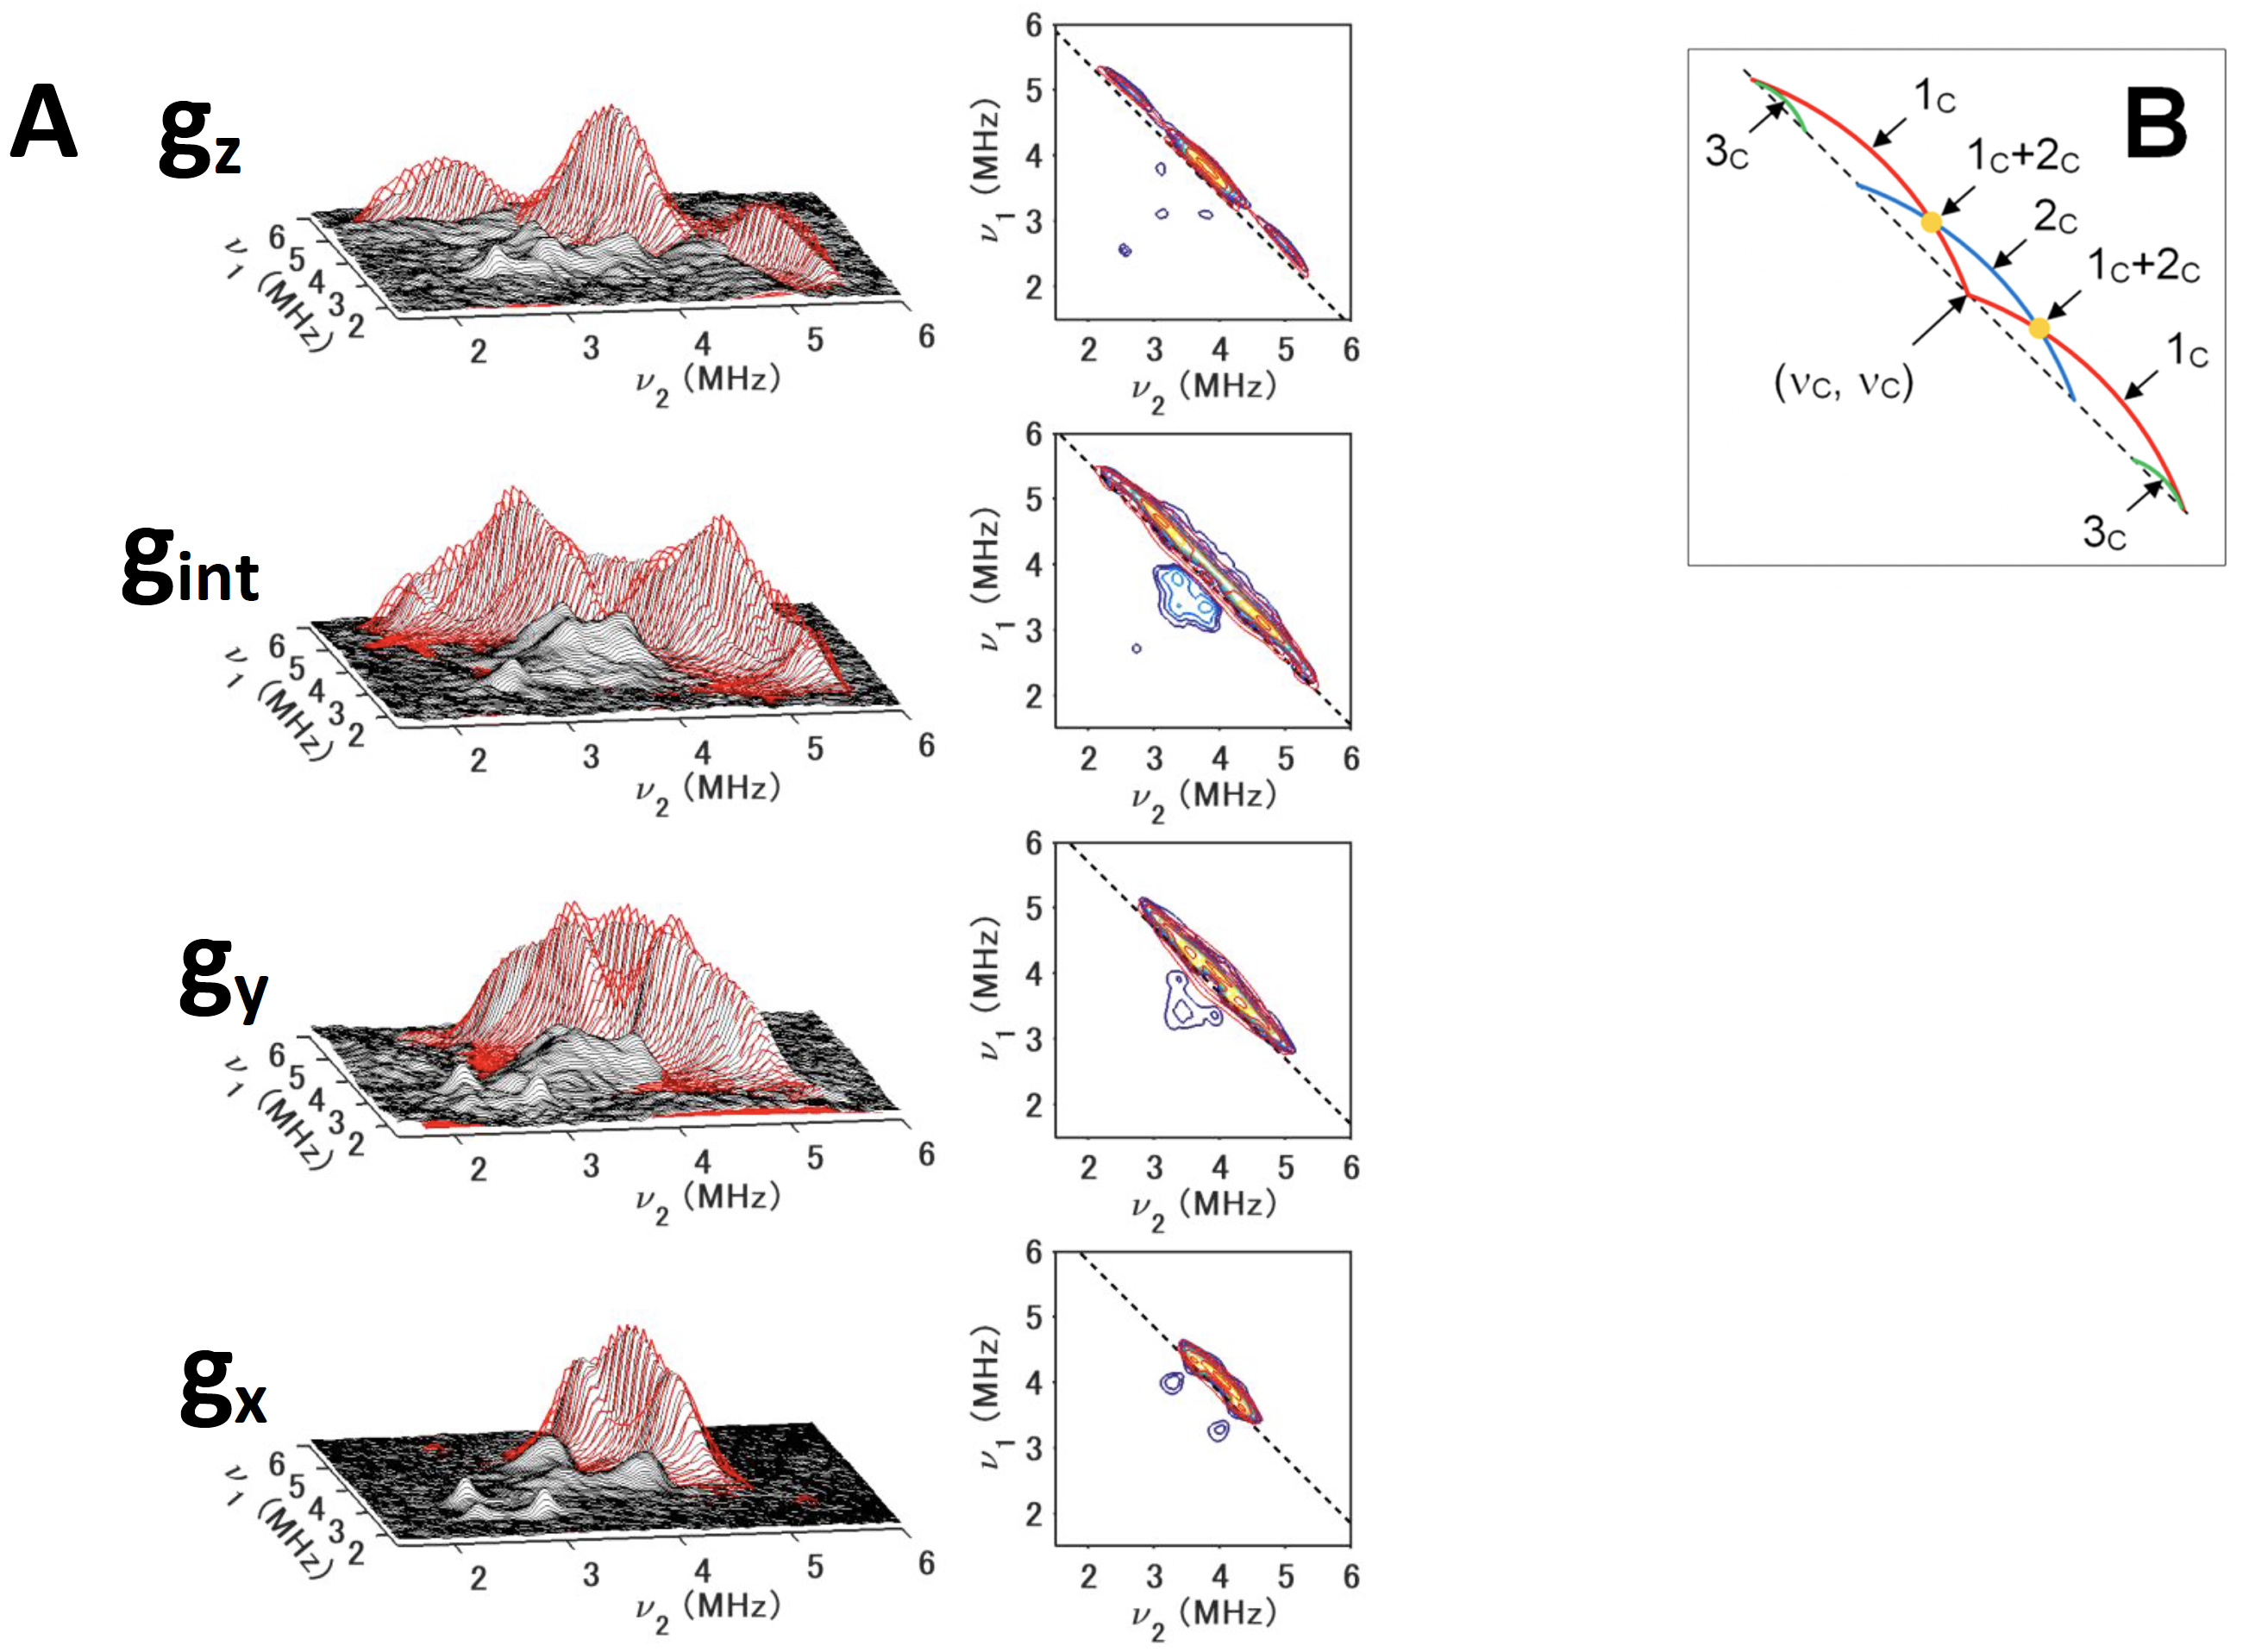
Figure 11. 13Cβ(Cys) HYSCORE spectra of 13Cβ(Cys)-labeled, reduced TthNEET in the 14N (natural abundance)-protein background, measured at gz (345,8 mT) (top), gint (352.8 mT) (first middle) , gy (359.8 mT) (second middle), and gx (366.8 mT) (bottom), shown in three-dimensionally stacked (left) and contour (right) representations, respectively (A), and schematic diagrams of the powder 13C HYSCORE spectra (B) for the simulated cross-ridge line shapes (the schematic figures are not drawn to scale, and the cross-ridge curvature is exaggerated for the sake of clarity). The spectral simulations are colored red overlaying the experimental 13C HYSCORE spectra in the (++) quadrant. In the contour representations, the dashed lines along the antidiagonal are defined by να + νβ = 2ν(13C). In the optimized EasySpin simulations of the TthNEET spectra (A), the inclusion of some rhombicity (δ= 0.2) into the 13C hyperfine tensors for 1c and 2c was found to be necessary to model the experimental HYSCORE cross-ridge shapes. For 3c, the spectral intensity was too low for a meaningful least-squares optimization. Therefore, an axial hyperfine tensor was assumed (δ= 0), and the Euler angles were adjusted manually by eye. This figure was prepared by Dr. Alexander Taguchi.
Out of all three model proteins, a thermophile mitoNEET [2Fe-2S](His)1(Cys)3 protein homolog from Thermus thermophilus strain HB8 (TthNEET) exhibits the largest asymmetry in the ligand type arrangement, with two Cys ligands at the nonreducible Fe3+ site and one Cys ligand at the reduced Fe2+ site. The 13Cβ-Cys HYSCORE spectra show two anisotropic cross-ridges (1c and 2c) and a third isotropic cross-peak 3c at low contour levels (Fig. 11). An important advantage of the two-dimensional pulsed EPR spectroscopic approach is the resolution of cross-ridges from nuclei with different degrees of hyperfine anisotropy. These features would otherwise be masked by more intensive ridges in one-dimensional spectra.
A full analysis of the 13Cβ(Cys) HYSCORE spectra acquired at multiple orientations spanning the full g-tensor for each protein was performed, in conjunction with spectral simulations performed with EasySpin v5.0.9. The 13C hyperfine tensors are grouped by their value of T, where 1c and 2c exhibit a high degree of anisotropy (1.2−1.4 MHz) and 3c and 4c are less anisotropic (0.3−0.5 MHz) (Table 1). The range of these 13Cβ hyperfine anisotropies can be explained by the point−dipole model for the magnetic interaction between the 13C nucleus and the Fe spin density. By modeling the Fe3+ and Fe2+ spin populations with the normalized coefficients DS determined in similar protein systems (+1.60 to +1.85 for Fe3+ and −0.55 to −1.24 for Fe2+), the dipolar contribution to the anisotropic constant for a coordinated Cys-Cβ is estimated to be 0.9−1.0 MHz for the Fe3+ ligands and 0.3−0.7 MHz for the Fe2+ ligands. Comparison of these two scenarios with the values of T in Table 1 allows the clear assignment of 1c and 2c to Fe3+ ligands, and 3c and 4c to Fe2+ ligands. For TthNEET, 3c is immediately assignable to Cys48 at the Fe2+ site (Fig. 12).
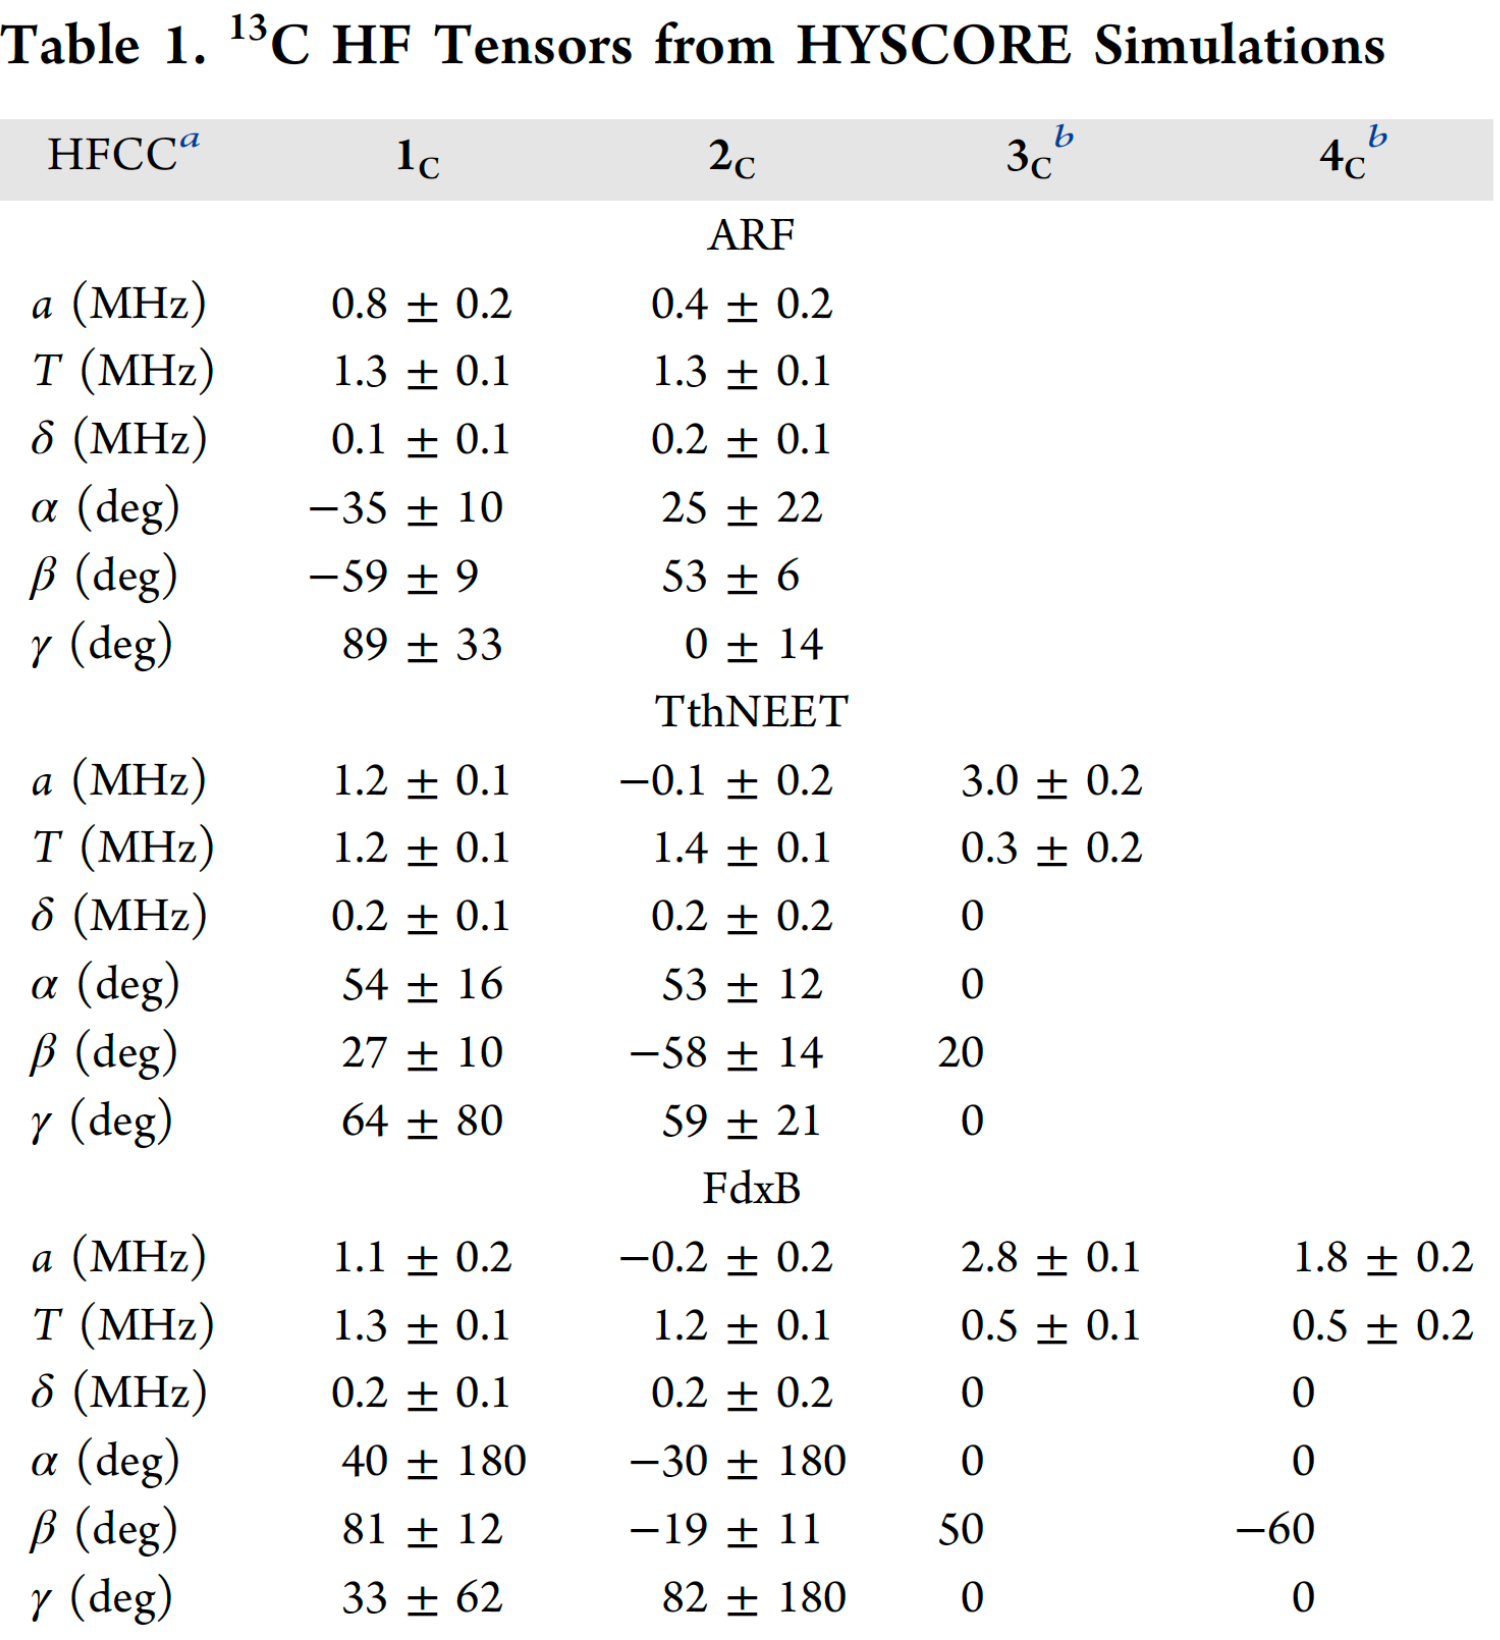
a Hyperfine (HF) coupling constants. a, T, and δ are the isotropic, anisotropic, and rhombic constants, respectively. Euler angles α, β, and γ describe the rotations that bring the g-tensor into the hyperfine tensor eigenframe. b Due to the low intensity of 3c and 4c, axial hyperfine tensors were assumed (δ= 0) and the Euler angles were adjusted manually. The errors reported for a and T were thus estimated by eye.
For the assignments of the 13C tensors to particular nuclei in a residue-specific manner, an analysis of the simulated Euler angles (α, β, γ) within the gtensor reference frame must be considered. Only for FdxB has the g-tensor orientation been determined (Fig. 7), and therefore, the discussion will be limited to this system. For the point−dipole interaction between the 13Cβ and its nearest iron, the A∥ component of the HF tensor is expected to lie along the line connecting the two atoms. The Euler angle β (angle between A∥ and gz) predicted from the FdxB structure (3AH7.pdb) is 11° for Cys50 and 82° for Cys86. These values only agree with the assignment of 1c to Cys86 and 2c to Cys50 (Table 1 and Fig. 12). The Fe2+ coordinated cysteines are not considered here, because the Euler angles for these 13Cβ(Cys) tensors (3c and 4c) could not be accurately determined.
The 13Cβ(Cys) isotropic hyperfine couplings in Table 1 are directly related to the degree of unpaired spin delocalization onto the cysteine ligands of the biological [2Fe-2S](His)n(Cys)4-n (n = 0, 1, 2) cluster. After integrating these results with previously reported hyperfine couplings for the remote nitrogens of the histidine ligands, a detailed map of the unpaired s-spin density distribution in the immediate cluster environment relevant to biological electron transfer is constructed (Fig. 12). Our results identified the highly asymmetric pattern of the spin distribution in all three systems, with a consistent trend where approximately five-fold more electron spin density is transferred onto the β-carbons of the Fe2+-bound cysteine ligands than those of Fe3+, despite the lower S = 2 spin of Fe2+ than S = 5/2 of Fe3+. These results suggest that the local structural asymmetry enforced by the surrounding polypeptide chain, rather than the types of the cluster ligands, regulates the electron spin distribution across Cβ(Cys) nuclei at the reduced [2Fe-2S] cluster site.
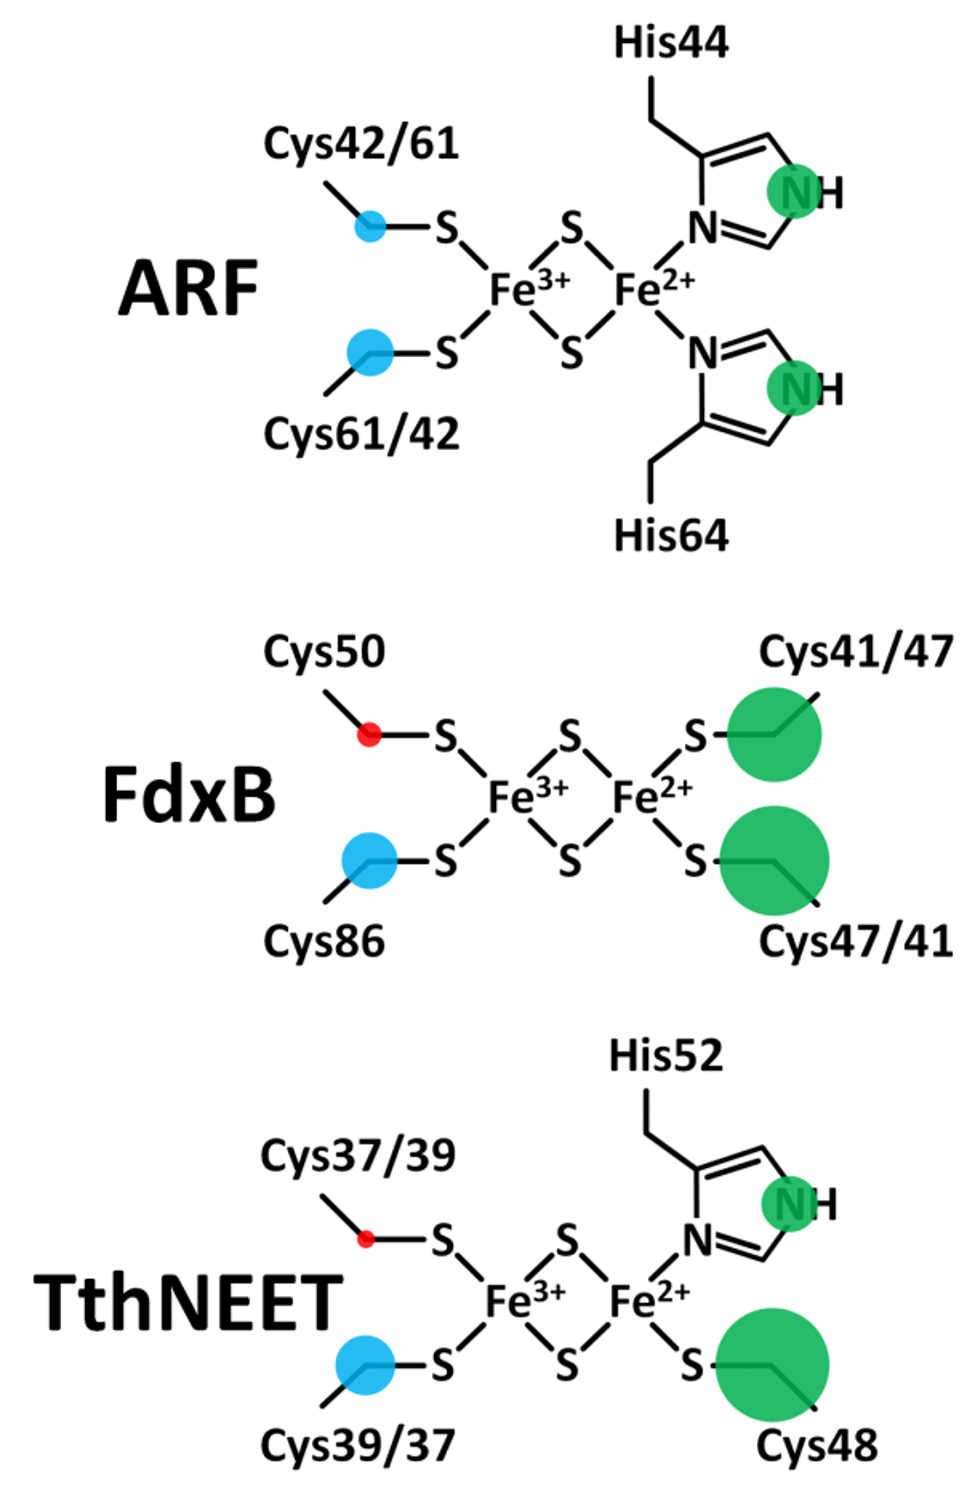
Figure 12. Maps of the outer-shell s-orbital electron spin density distribution onto the ligands of the reduced ARF (top), FdxB (middle), and TthNEET (bottom) clusters. Positive and negative electron spin is shown in blue and red, respectively. Green indicates the sign is unknown. The areas of the circles show the relative spin populations. This figure was prepared by Dr. Alexander Taguchi.
The fundamental redox chemical properties of the biological Fe-S cluster are primarily defined by the covalency of the Fe−ligand interactions. The present 13Cβ(Cys) HYSCORE analysis of the reduced [2Fe-2S](His)n(Cys)4‑n (n = 0, 1, 2) proteins successfully resolves the covalent interactions of the cysteine ligands with the same iron for the first time. The electron spin population on Cβ(Cys) corresponds to the degree of spin delocalization via orbital overlap, and should therefore provide a relative measure of the Sγ(Cys)-Fe covalencies. In ARF, the electron spin populations on 13Cβ of Cys42 and Cys61 were found to differ by only 0.8 X 10^−4, suggesting slightly different covalencies of the two Sγ(Cys)−Fe bonds. For the Fe3+ ligands of FdxB and TthNEET, where the ligand placement relative to the cluster is asymmetrical, the differences in spin populations are greater at 2.3 X 10^−4 and 2.4 X 10^−4, respectively. A similar situation applies to the Fe2+ ligands of FdxB where the difference in Cβ(Cys) spin densities is 2.7 X 10^−4. For the Fe3+ ligands of FdxB, the greater spin transfer to the Cys86-Cβ would suggest that Cys86 has the stronger of the two Sγ(Cys)−Fe covalent interactions. The preferred delocalization of the electron spin along the Fe2+ site ligands for all clusters studied (Fig. 12) correlates well with electron transfer directionality of these proteins; redox chemistry is exclusively catalyzed at the reducible Fe2+/Fe3+ site of the cluster, maximizing the electronic coupling with redox partners.
*One can follow the link to read the original article of this work.
up
The best-fit g-tensor direction of reduced FdxB and ARF defined by 13Cβ(Cys) hyperfine tensors
Interpretation of magnetic resonance data in the context of structural and chemical biology requires prior knowledge of the g-tensor directions for paramagnetic metallo-cofactors with respect to the protein structural frame. Access to this information is often limited by the strict requirement of suitable protein crystals for single-crystal EPR measurements or the reliance on protons (with ambiguous locations in crystal structures) near the paramagnetic metal site. In an orientation-selective pulsed EPR experiment, the hyperfine interactions of the paramagnetic center with the surrounding nuclei are measured as a function of the g-tensor orientation. This is achieved by taking measurements at different magnetic fields, thereby exciting only a subset of g values out of the full g-tensor at a time. Simulation analysis of the 13C HYSCORE spectra collected at multiple magnetic field positions spanning the full g-tensor for each protein (see Fig. 10) therefore provides the principal values of the 13Cβ(Cys) tensors and Euler angles that define the directions of the hyperfine principal axes in the g-tensor reference frame, whereever possible.
In the point-dipole approximation for the hyperfine interaction between the 13Cβ(Cys) nuclear spin and the electron spin density on the nonreduced Fe3+ site of the protein-bound, reduced [2Fe-2S] cluster, the largest component (A||) of the 13Cβ(Cys) hyperfine tensor is expected to lie along the 13Cβ(Cys)−Fe3+ direction, and Euler angles α and β from the 13Cβ(Cys) hyperfine tensor are the primary source of information to describe a distribution of the allowed directions for the g-tensor axes where only the angle between A|| and any individual g-tensor axis is known. While Euler angle α could not be determined with accuracy in the reduced FdxB system (the simulated angles had errors of ±180°, because the g-tensor is strongly axial), simulated Euler angle β from the experimental 13C HYSCORE spectra (Fig. 10A) provides information about the spatial orientations of the largest parallel components (A||) of the 13Cβ(Cys) hyperfine tensors at the Fe3+ site of FdxB as β = −19 ± 11° for Cys50 and β = 81 ± 12° for Cys86. The range of angles for β agrees well with the expected values based on the best-fit g||-tensor directions of the FdxB system determined by orientation-selective 1H ENDOR (β = −11° for Cys50, and β = 82° for Cys86) (Fig. 7), such that the average g||-tensor direction points roughly toward Cys50 13Cβ from the Fe3+ site and is skewed from the normal of the [2Fe-2S] plane (Fig. 13). The g-tensor directions of the protein-bound, reduced [2Fe-2S](Cys)4 clusters seem to be primarily determined by the iron−cysteine bond interactions and the conformation of the cysteine ligands relative to the [2Fe-2S] core plane and are not grossly influenced by other protein structural factors surrounding the [2Fe-2S](Cys)4 cluster site.
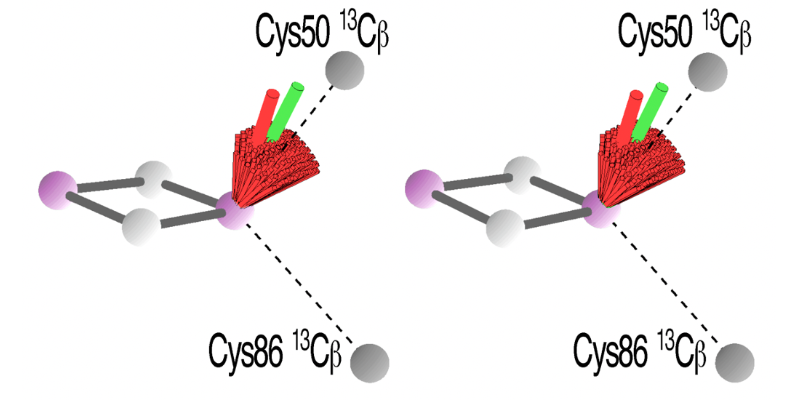
Figure 13. Possible g-tensor directions of the reduced [2Fe-2S](Cys)4 cluster system of FdxB (gmax = 2.020, gint = 1.936, and gmin = 1.934) calculated from the 13Cβ(Cys) Euler angles under the point-dipole approximation for the magnetic interaction between the 13Cβ(Cys) nuclear spin and the electron spin density on Fe3+ [indicated by 13Cβ(Cys)−Fe3+ (dashed lines)], using the simulated 13Cβ(Cys) hyperfine tensors as constraints. The possible g|| (gmax) directions of FdxB from the 13Cβ(Cys) HYSCORE simulation analysis, which point roughly toward Cys50 13Cβ(Cys), are shown as a red bundle, with the best fit shown with an extended red rod, in wall-eye stereoview representations, demonstrating the successful reproduction of the average g|| direction of this system determined by 1H ENDOR (green rod; see Fig. 7). Cys50/86 13Cβ, Fe, and S atoms are shown as dark gray, purple, and white spheres, respectively. This figure was prepared by Dr. Alexander Taguchi.
The 13Cβ(Cys) HYSCORE approach was further used to determine the approximate g-tensor directions of the reduced Rieske-type [2Fe-2S](His)2(Cys)2 cluster in ARF, for which single-crystal EPR analysis is not feasible. In this system, the residue-specific assignments of the 13Cβ(Cys) hyperfine tensors of the two cysteine ligands (Cys42 and Cys61) at the non-reduced Fe3+ site of the reduced cluster could not be determined because of the pseudo-two-fold symmetrical locations of the 13Cβ(Cys42) and 13Cβ(Cys61) atoms relative to the Rieske-type [2Fe-2S] cluster plane (Fig. 12). Although a self-consistent, unique determination of the approximate g-tensor directions is inherently not possible, an analysis of the reduced ARF system gave almost the same g-tensor orientation for the two possible assignments of α = 25 ± 22° and β = 53 ± 6° to Cys42/Cys61, and α = −35 ± 10° and β = −59 ± 9° to Cys61/Cys42 (Fig. 14A, B). Notably, the calculated g-tensors are insensitive to these two scenarios because of the similarity in magnitude of the 13Cβ(Cys) Euler angles, both indicating strongly collinear g-tensor directions with respect to the molecular structural frame of the Rieske-type [2Fe-2S] cluster core, with the gx component pointing roughly along the Fe-Fe direction of the reduced cluster (Fig. 14). Although the extent of this skewing from the ARF cluster plane is less than that previously determined for the cytochrome bc1-associated, reduced Rieske [2Fe-2S] protein system by other methods, the gx, gz, and gy components of the reduced ARF system point roughly along the molecular structural axes defined by the Fe−Fe direction, the S−S direction, and the axis perpendicular to the cluster plane, respectively (Table 2 and Fig. 14C), suggesting that the approximate g-tensor directions are conserved across the phylogenetically and functionally divergent Rieske-type [2Fe-2S] proteins in biology.
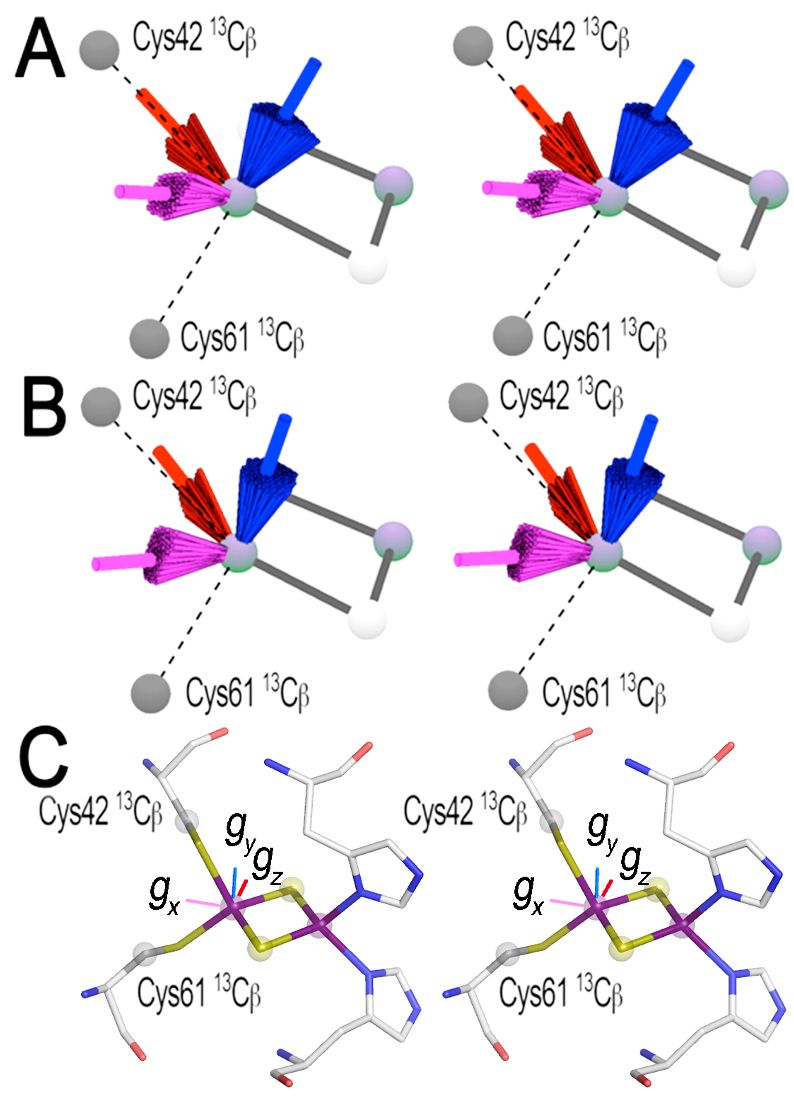
Figure 14. Determination of the allowed (colored bundles) and best-fit (long colored rods) g-tensor directions of the reduced Rieske-type [2Fe-2S](His)2(Cys)2 cluster system (gz = 2.022, gy = 1.901, and gx = 1.804) relative to the protein structural frame of ARF in wall-eye stereoview representations, based on the simulation of the two axial 13Cβ(Cys) hyperfine tensors. For the assignment of Euler angles α = 25 ± 22° and β = 53 ± 6° to Cys42, and α = −35 ± 10° and β = −59 ± 9° to Cys61, the number of possible solutions is reduced to a single localized bundle of g-tensors when additional constraints from previous g-tensor studies of Rieske protein systems are taken into account (A). The g-tensor distribution was also calculated under these constraints for the alternate assignment of Euler angles α = 25 ± 22° and β = 53 ± 6° to Cys61 and α = −35 ± 10° and β = −59 ± 9° to Cys42 (B). Although a self-consistent, unique determination of the best-fit gtensor directions is inherently not possible with only the two 13Cβ(Cys42/61) axial hyperfine tensors available, the two resulting g-tensor distributions [red bundle, average gz (gmax) direction; blue bundle, average gy (gint) direction; and magenta bundle, average gx (gmin) direction] for the two possible assignments of the Euler angles to Cys42 and Cys61 are very similar to each other in the reduced ARF system (A and B), where the best-fit gx direction (magenta) is almost along the Fe−Fe direction and the best-fit gz direction (red) is almost along the S−S direction (C, depicted by PyMOL v0.99). Panels A and B in this figure were prepared by Dr. Alexander Taguchi.
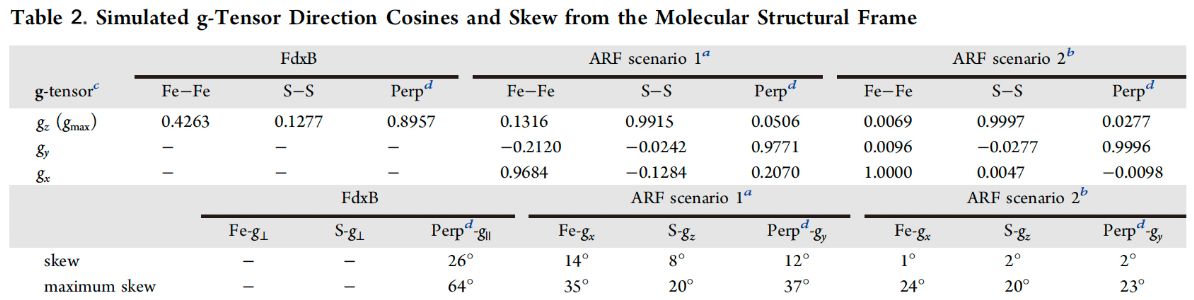
a Euler angle assignments of α = 25° and β = 53° to Cys42 and α = −35° and β = −59° to Cys61. b Euler angle assignments of α = 25° and β = 53° to Cys61 and α = −35° and β = −59° to Cys42. c Simulated g values: gmax = 2.020, gint = 1.936, and gmin = 1.934 for FdxB, and gz = 2.022, gy = 1.901, and gx = 1.804 for ARF. d Perpendicular to the [2Fe-2S] plane.
One may postulate that the extent of g-tensor skewing in the protein-bound, reduced [2Fe-2S] clusters is correlated primarily to the conformational variations in the cysteine ligands at the nonreduced Fe3+ site of the reduced [2Fe-2S](His)n(Cys)4−n cluster (n = 0 or 2), to the local structural distortions around the Fe2+ site environment, and possibly to a lesser extent the pattern of peptide hydrogen bonding with the bridging and terminal sulfur atoms. By this logic, the local structure and molecular interactions around the Fe3+ site environment of the reduced cluster would appear to be highly symmetrical for the ARF spin system. Although the origin and extent of the distortion and skewing of the g-tensor axes in biological Fe-S protein systems are not well-understood, a larger protein model (in C1 symmetry) of the cluster site and its surrounding region will likely help improve molecular quantum theoretical calculations and bridge the gap between high-resolution magnetic resonance data and a deeper understanding of the protein structure−electron transfer function relationships in redox biology.
*One can follow the link to read the original article of this work.
up
 Go to the ICC Project Details Page